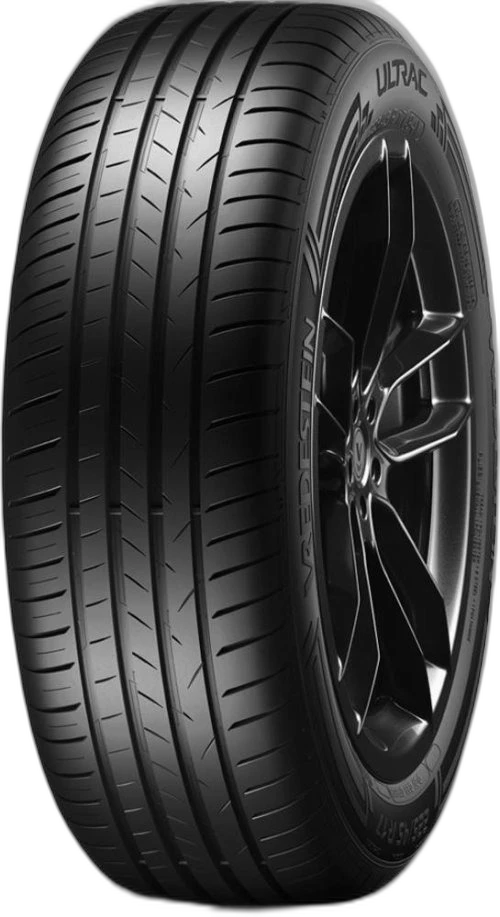
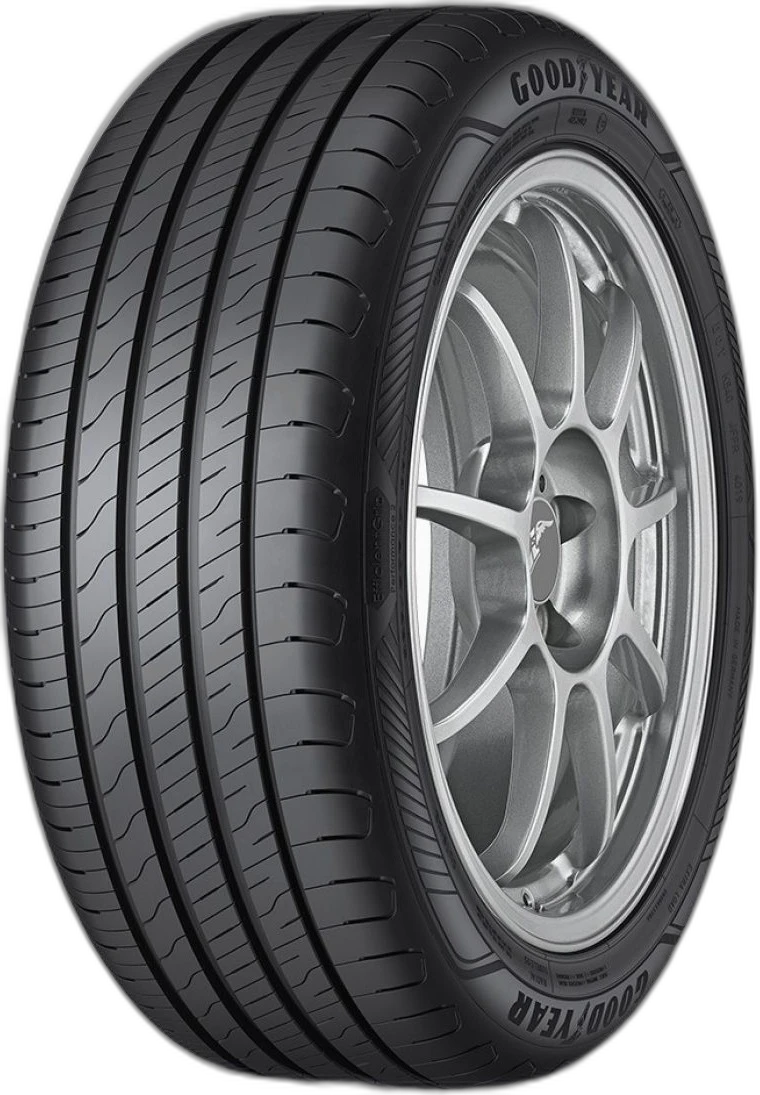
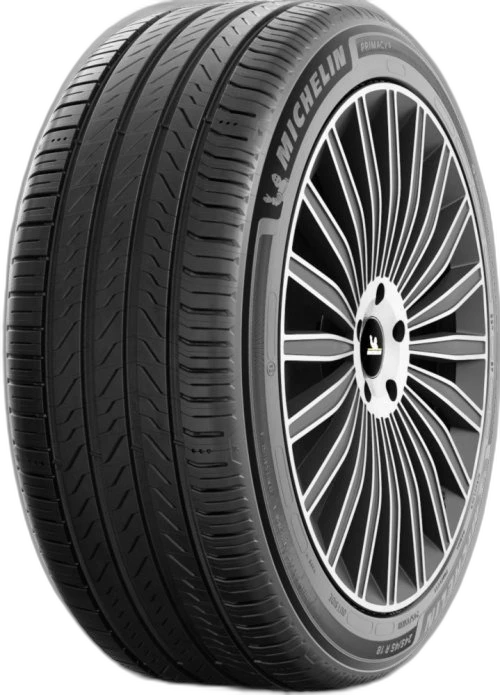
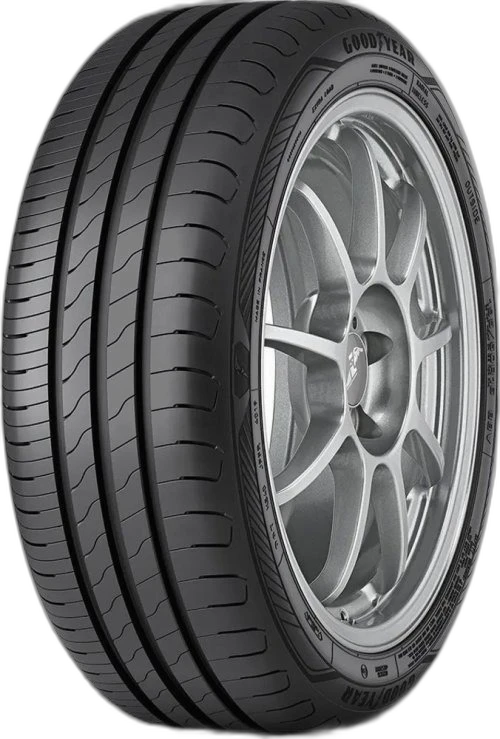
Vergleich: Vredestein ULTRAC gegen Goodyear Efficient Grip Performance 2 gegen Michelin Primacy 5 gegen Falken e.Ziex gegen GoodYear Efficientgrip Performance 2
Auch vergleichen mit


Diese Reifen wurden nicht gemeinsam im selben Test geprüft. Die nachfolgenden Wertungen sind aus verschiedenen unabhängigen Tests zusammengefasst – ein direkter Vergleich sollte daher mit Vorsicht interpretiert werden.

 Vredestein ULTRAC Goodyear Efficient Grip Performance 2Michelin Primacy 5Falken e.ZiexGoodYear Efficientgrip Performance 2Vredestein ULTRAC Goodyear Efficient Grip Performance 2Michelin Primacy 5Falken e.ZiexGoodYear Efficientgrip Performance 2Vredestein ULTRAC Goodyear Efficient Grip Performance 2Michelin Primacy 5Falken e.ZiexGoodYear Efficientgrip Performance 2Vredestein ULTRAC Goodyear Efficient Grip Performance 2Michelin Primacy 5Falken e.ZiexGoodYear Efficientgrip Performance 2Vredestein ULTRAC Goodyear Efficient Grip Performance 2Michelin Primacy 5Falken e.ZiexGoodYear Efficientgrip Performance 2Vredestein ULTRAC Goodyear Efficient Grip Performance 2Falken e.ZiexGoodYear Efficientgrip Performance 2Vredestein ULTRAC Goodyear Efficient Grip Performance 2Michelin Primacy 5Falken e.ZiexGoodYear Efficientgrip Performance 2Vredestein ULTRAC Goodyear Efficient Grip Performance 2Michelin Primacy 5Falken e.ZiexGoodYear Efficientgrip Performance 2Vredestein ULTRAC Goodyear Efficient Grip Performance 2Michelin Primacy 5Falken e.ZiexGoodYear Efficientgrip Performance 2Vredestein ULTRAC Goodyear Efficient Grip Performance 2Michelin Primacy 5Falken e.ZiexGoodYear Efficientgrip Performance 2Vredestein ULTRAC Goodyear Efficient Grip Performance 2Michelin Primacy 5Falken e.ZiexGoodYear Efficientgrip Performance 2Vredestein ULTRAC Goodyear Efficient Grip Performance 2Michelin Primacy 5Falken e.ZiexGoodYear Efficientgrip Performance 2Vredestein ULTRAC Goodyear Efficient Grip Performance 2Michelin Primacy 5Falken e.ZiexGoodYear Efficientgrip Performance 2Vredestein ULTRAC Goodyear Efficient Grip Performance 2Michelin Primacy 5Falken e.ZiexGoodYear Efficientgrip Performance 2Vredestein ULTRAC Goodyear Efficient Grip Performance 2GoodYear Efficientgrip Performance 2Vredestein ULTRAC Goodyear Efficient Grip Performance 2Michelin Primacy 5GoodYear Efficientgrip Performance 2Vredestein ULTRAC Vredestein ULTRAC Goodyear Efficient Grip Performance 2Michelin Primacy 5Falken e.ZiexGoodYear Efficientgrip Performance 2Vredestein ULTRAC Goodyear Efficient Grip Performance 2Michelin Primacy 5Falken e.ZiexGoodYear Efficientgrip Performance 2Vredestein ULTRAC Goodyear Efficient Grip Performance 2Michelin Primacy 5Falken e.ZiexGoodYear Efficientgrip Performance 2
Preise in allen verfügbaren reifendimensionen dieser reifen vergleichen.
 VSVSVSVS
 VSVS
VSVS VS
VS VSVSVSVredestein ULTRAC vs Continental PremiumContact 7Vredestein ULTRAC vs Vredestein UltracVredestein ULTRAC vs Michelin Primacy 4+Vredestein ULTRAC vs Hankook Ventus Prime 4Goodyear Efficient Grip Performance 2 vs Bridgestone Turanza 6Goodyear Efficient Grip Performance 2 vs Hankook Ventus Prime 4Goodyear Efficient Grip Performance 2 vs Michelin e.PrimacyMichelin Primacy 5 vs Bridgestone Turanza T005